Stats
How your Mac is doing, in plain words
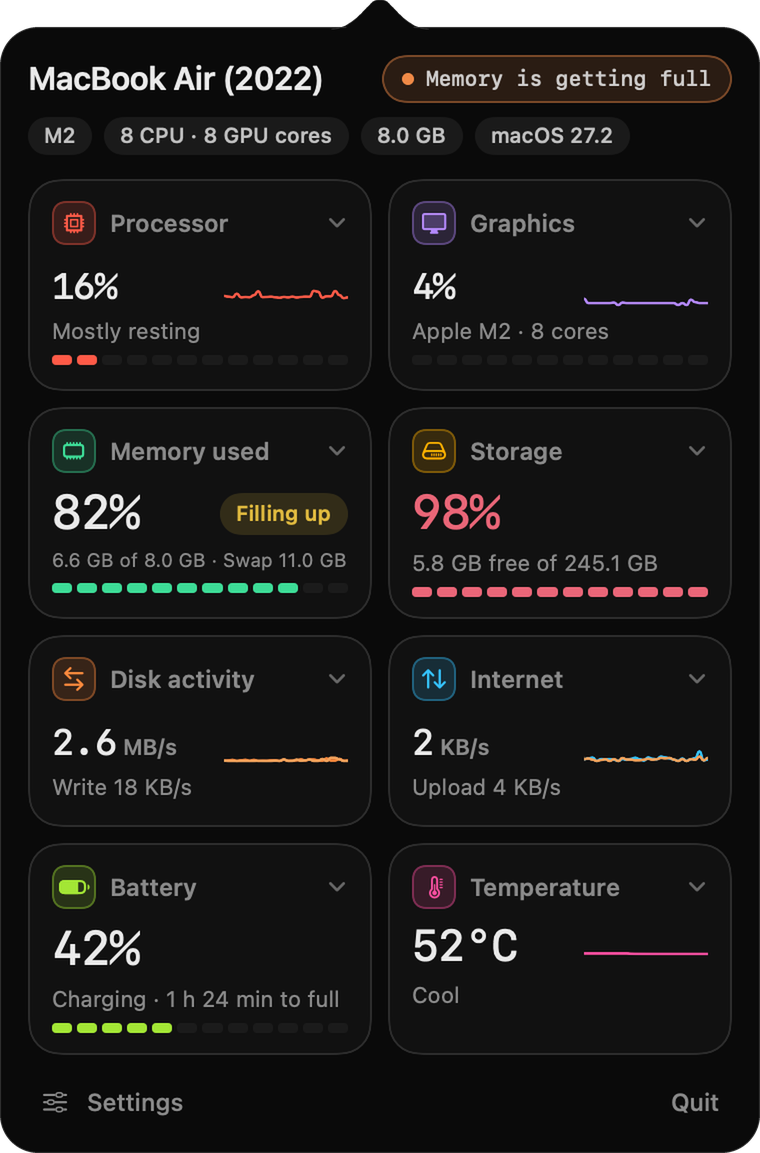
Stats lives in your menu bar. Click it to see live tiles for the processor, graphics, memory, storage, disk activity, internet, battery, temperature, fans and Bluetooth gadgets. Each tile says what is going on in everyday words, like “Plenty of room” or “Mostly resting”, and opens up for more detail.
Version 1.0.17. The download button always gives the newest build.
Mac: macOS 14 Sonoma or later. Windows: Windows 10 or 11, 64-bit. Free and open source (MIT licence).
What it does
Your Mac, at a glance
Stats sits in the menu bar and keeps the health of your Mac one click away. It is free and open source, and it speaks plainly.
Plain words, not jargon
Each tile says what is going on in everyday words, like “Plenty of room”, “Mostly resting” or “3 h 10 min left”, and opens up for more detail.
Live tiles
Processor, graphics, memory, storage, disk activity, internet, battery, temperature, fans and Bluetooth gadgets, with small graphs that fill in the moment you open the panel. Tap a tile to expand it and the grid stays neat.
Honest numbers
Battery time comes from the real power draw, battery health matches System Settings, and temperatures come from the processor sensors.
Your Mac at the top
The panel starts with your Mac’s model name and its chip, cores, memory and macOS version. A short note appears beside it when something needs attention, like memory getting full. Fans and Battery tiles hide themselves on Macs that have none. A short welcome tour opens on first launch, and you can add live readouts such as CPU or memory as extra menu bar items. Pick which tile opens by itself, and show every temperature sensor at full size.
A menu bar icon your way
Choose Bars, Chip, Pulse, a live graph of any reading, or hide the icon. It can turn green, amber or red with how hard your Mac is working.
Light, dark and your units
Light, dark or automatic. Pick °C or °F and MB/s or Mbps, and choose how often the numbers refresh. Pick an accent colour for the Settings screens too.
Alerts when it matters
Turn on alerts for low battery, full storage or squeezed memory.
Opens at login, updates itself
Open Stats at login so it is always there. It updates itself from the releases on GitHub.
A closer look
Open it and read it
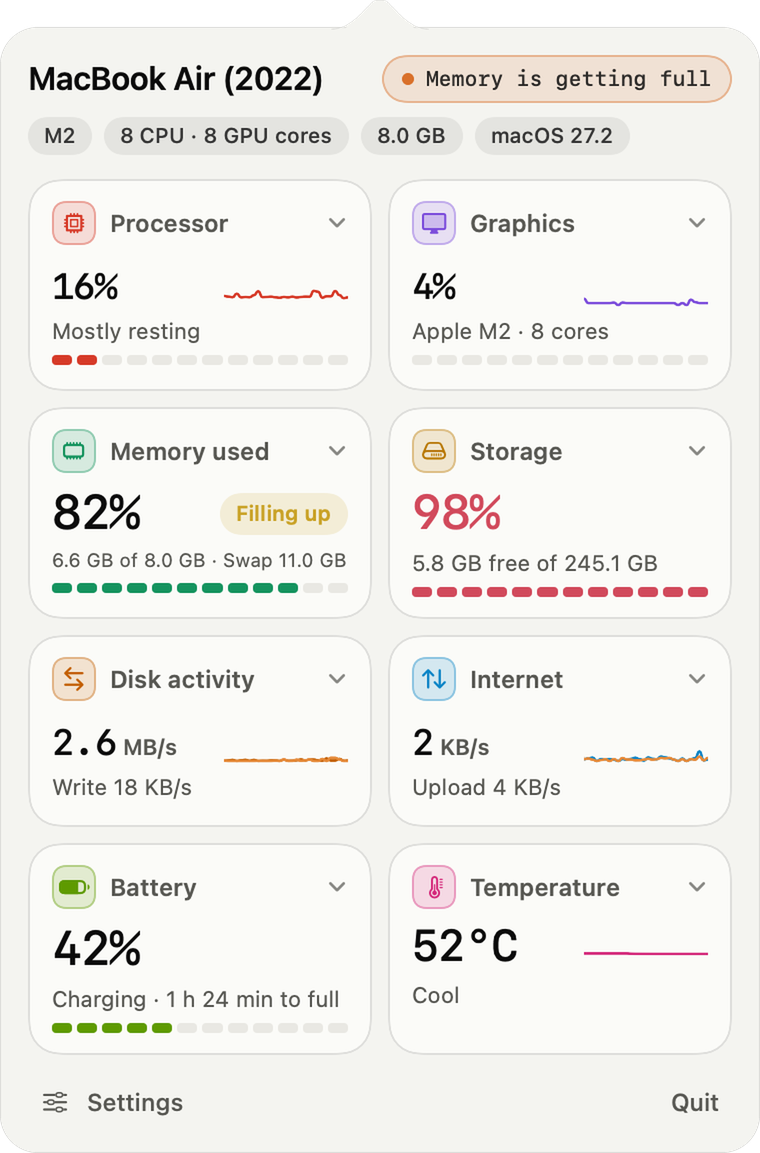
The panel in light and in dark.
Install
Install Stats
Download it, open it, drag it into Applications. Stats is signed and checked by Apple, so it opens like any normal app.
Mac
macOS 14 Sonoma or later
Download for Mac Stats.dmgOr paste this into Terminal. It downloads, installs and opens Stats in one go.
curl -fsSL https://solomon-69.github.io/Mac-Apps/download/install.sh | bash -s stats- Open the downloaded file and drag Stats into Applications.
- Open Stats from Applications. Look for the Stats icon in the menu bar and click it.
- Tap any tile to see more. Open Settings in the panel to choose your menu bar icon, units and alerts.
Windows
Windows 10 or 11, 64-bit
Download for Windows Stats-windows.zipPrefer an installer? Stats-Setup.exe does the same.
- Unzip the download and open Stats.exe. Look for the Stats icon in the tray, bottom right, and click it.
- Windows may show a blue screen because the app is not signed yet: choose More info, then Run anyway.
- Tap any tile to see more. Open Settings in the panel to choose units and alerts.
Questions
Good to know
Does Stats send my information anywhere?
Stats reads the numbers from your own Mac to draw its tiles. The one online thing it does is update itself from the releases on GitHub.
What does Stats show?
Live tiles for the processor, graphics, memory, storage, disk activity, internet, battery, temperature, fans and Bluetooth gadgets. Each one says what is going on in everyday words and opens up for more detail.
Can I change the menu bar icon?
Yes. Choose Bars, Chip, Pulse, a live graph of any reading, or hide it. It can turn green, amber or red with how hard your Mac is working.
Can I use Fahrenheit?
Yes. In Settings you can switch between °C and °F, and between MB/s and Mbps.
Does it work on every Mac?
Stats needs macOS 14 or later. It was built and tried on an Apple silicon MacBook Air, so fan readings and sensors on Intel Macs have not been tested yet.
Can I build it myself?
Yes. Stats is open source under the MIT licence. The code and build steps are on GitHub.
Opening the app
Stats is signed and checked by Apple (notarized), so it opens like any normal app: open the download, drag to Applications, double-click. You can check a download against the SHA-256 fingerprints in each release (the SHA256SUMS file) on GitHub.